Observability and API
Eneru v5.3+ includes read-only observability endpoints and outbound integrations. None of the API or MQTT surfaces here can trigger UPS shutdown, mutate state, or run commands you did not already configure for the daemon. Remote-health probes do execute SSH commands against your configured remote servers, but they are restricted to the harmless probe_command (true by default) and never touch your pre_shutdown_commands or shutdown_command. See "Remote SSH health" below for the safety contract.
API server
The API starts with eneru run when explicitly enabled:
v6.1.7 upgrade note: hostname access that was previously accepted (for
example nas.local or a reverse proxy preserving its public Host) now needs an
api.allowed_hosts entry. A rejected request returns 421 and Eneru logs the
first rejected Host with this configuration hint, so a suddenly blank
dashboard has a searchable server-side explanation.
For container healthchecks, the same settings can be enabled at runtime:
Endpoints:
| Endpoint | Purpose | Status codes |
|---|---|---|
/health |
API process is alive | 200 |
/ready |
Monitoring has usable UPS visibility and every configured shutdown capability is achievable | 200 ready / 503 not ready |
/api/v1 |
API endpoint index | 200 |
/api/v1/ups |
Current UPS/group status | 200 |
/api/v1/ups/<name> |
One UPS status | 200 / 404 |
/api/v1/ups/<name>/history |
SQLite metric history (metric, from, to) |
200 / 400 (bad metric or from > to) / 404 |
/api/v1/events |
Recent event rows (limit, verbosity, from, to, before) |
200 / 400 (bad query) |
DELETE /api/v1/ups/<name>/events |
Delete selected events (auth required) | 200 / 400 / 401 / 403 / 404 / 413 / 503 |
/api/v1/config |
Sanitized config summary | 200 |
/api/v1/auth/state |
Effective auth state for dashboard login bootstrap | 200 |
/api/v1/remote-health |
Remote SSH health status | 200 |
/metrics |
Prometheus text metrics | 200 / 404 (Prometheus disabled) |
The API is disabled by default. When enabled, the default bind address is localhost. If you set api.bind to a non-loopback address (e.g. 0.0.0.0) without enabling authentication, Eneru warns at startup: /api/v1/config returns configured server hostnames and presence flags, so anyone who can reach the socket can read that. Keep the API behind SSH, a local reverse proxy, a trusted network boundary, or enable api.auth.
No built-in TLS — trusted-LAN by design. Eneru serves plain HTTP and does not terminate TLS itself; this is a deliberate scope decision for a homelab-scale, trusted-LAN daemon, not an oversight. On the default loopback bind nothing leaves the host. If you must reach the API from another machine, do not expose the plain-HTTP socket directly — put it behind a reverse proxy that terminates TLS (and, ideally, adds auth), and keep the daemon itself on loopback. Bearer tokens and login passwords travel in cleartext on any non-loopback plain-HTTP bind, so treat an unproxied off-host bind as readable by anyone on the wire.
DNS-rebinding protection. Because read endpoints are open by default, a hostile web page loaded in an operator's browser could otherwise use DNS rebinding to point a name it controls at the daemon's LAN IP and read the API (topology, SSH usernames, events) from inside the browser. Eneru validates the request Host header: an IP-literal Host (192.168.1.10:9191, [::1]:9191) or localhost is always accepted — so browsing the dashboard by IP is unaffected — while a request carrying any other DNS name is answered 421 Misdirected Request and never routed. If you front the API with a hostname (e.g. behind a reverse proxy or a friendly LAN name), list the names you serve it under in api.allowed_hosts (case-insensitive):
Authentication (v6.0)
Authentication is opt-in via api.auth.enabled and is tiered. The login body
is a JSON object: {"username": "<username>", "password": "<password>"}.
| Surface | auth.enabled=false |
auth.enabled=true |
|---|---|---|
/health, /ready |
open | open (always) |
/metrics, /api/v1/ups*, /history, /events, /remote-health |
open | open unless require_for_reads |
/metricsdiscloses topology. Prometheus label values include UPS names and other identifying detail./metricshonorsrequire_for_readslike the other read endpoints, but if you scrape it through a proxy, put/metricsbehind the same auth boundary as the rest of the read API — don't expose it unauthenticated just because a scraper is easier to wire up that way. |/api/v1/config| sanitized | sanitized (anonymous) / extended (authenticated) | |/api/v1/auth/state| open | open (always) | | write endpoints (UPS control, config reload) | hard-disabled (403) | required (401 without a credential) |
"Auth disabled" always means read-only: write features cannot be reached, and enabling a control feature while auth is off is a startup error. If api.auth.enabled is left unset, auth activates automatically once the auth DB contains at least one user; if the DB file exists but cannot be read, Eneru fails closed and treats auth as active. See Authentication for the user/API-key model and the eneru user / eneru apikey CLI.
Logging in. POST /api/v1/auth/login with a JSON body {"username": "<username>", "password": "<password>"} returns a bearer token:
Send it as Authorization: Bearer <token> on subsequent requests (programmatic clients send an API key the same way, or via X-API-Key). POST /api/v1/auth/logout invalidates a session token. Sessions live in memory, expire after api.auth.session_ttl seconds, and are invalidated if the user is deleted or their password is reset; they do not survive a daemon restart.
Example response shapes:
// GET /api/v1/ups
{
  "generatedAt": 1720000000.0,
  "ups": [
    {
      "name": "ups0", "label": "Rack-A", "groupId": "ups0",
      "status": "OL CHRG", "batteryCharge": 97, "runtime": 1200,
      "load": 20, "depletionRate": 0.0, "timeOnBattery": 0,
      "powerQuality": {
        "inputVoltage": "229.4", "outputVoltage": "230.1",
        "batteryVoltage": "27.2", "temperature": "32",
        "inputFrequency": "50.0", "outputFrequency": "50.0",
        "voltageState": "NORMAL", "avrState": "INACTIVE",
        "bypassState": "INACTIVE", "overloadState": "INACTIVE",
        "nominalVoltage": 230.0, "warningLow": 207.0, "warningHigh": 253.0
      },
      "connectionState": "OK", "triggerActive": false,
      "remoteHealth": [...]
    }
  ],
  "redundancyGroups": []
}

// GET /api/v1/events?limit=2&verbosity=1
{"generatedAt": 1720000000.0, "events": [{"ts": 1720000000, "category": "power_event", "event": "ON_BATTERY", "details": "..."}]}
UPS rows include a stable groupId derived from the configured UPS name. Multi-UPS responses also include redundancyGroups rows with their source UPS names, quorum target, server-computed healthyCount / quorumLost, per-member raw/effective health, locality flag, and remote-health rows. During evaluator cold start, quorumDeferred is true and quorumLost remains false until members have had their first-report window.
powerQuality mixes JSON strings and numbers by source: raw NUT readings (inputVoltage, outputVoltage, batteryVoltage, temperature, inputFrequency, outputFrequency) and state labels (voltageState, avrState, bypassState, overloadState) are strings; Eneru-derived values (nominalVoltage, warningLow, warningHigh) are numbers. Strings are empty when the UPS does not publish that NUT field. Consumers that compare numeric ranges should coerce the string fields with float() (or | float in Home Assistant templates) and treat empty strings as missing data.
/api/v1/events accepts limit and verbosity query parameters. verbosity=0 returns power/shutdown events, verbosity=1 also includes diagnostics, and verbosity=2 returns all recorded events including lifecycle rows.
For wide-range viewing and paging, /api/v1/events also accepts from/to (Unix seconds) and a source-qualified cursor: before=<ts>&beforeSource=<source>&beforeId=<id>, using the oldest row already displayed. Each event row carries the required identity: source (the UPS groupId) plus id (a stable, never-reused per-UPS row id), alongside ts, eventType, and detail. Clients should still de-duplicate loaded pages by (source, id). A timestamp-only before=<ts> is accepted for compatibility and uses an inclusive timestamp boundary. Likewise, /api/v1/ups/<name>/history accepts from/to; omitting from returns from the earliest retained data (the hourly-aggregate retention horizon), and from > to is a 400.
Deleting events. DELETE /api/v1/ups/<name>/events removes selected events. It requires authentication (writes are hard-disabled when api.auth is off -> 403; missing credential -> 401). The JSON body is {"items": [{"id": <int>, "ts": <int>, "eventType": "<str>"}, ...]} (max 1000 items -> 413; malformed -> 400). Each row is matched on all three fields, so a stale client can only delete the exact rows it last saw. A mismatch deletes nothing. The response is {"ups": "<name>", "deleted": <count>}; if statistics is disabled the endpoint returns 503. Deletions are recorded to the events table as EVENTS_DELETED audit rows.
Transport security
The embedded API speaks plain HTTP — it has no built-in TLS. On loopback
(127.0.0.1, the default) that is fine. If you bind it to a routable address,
login passwords and bearer tokens travel unencrypted, so put a TLS-terminating
reverse proxy in front and keep the daemon on loopback. The daemon logs a
cleartext-transport warning at startup for any non-loopback bind.
Minimal Caddy:
Minimal nginx:
server {
    listen 443 ssl;
    server_name ups.example.com;
    ssl_certificate     /etc/ssl/ups.crt;
    ssl_certificate_key /etc/ssl/ups.key;
    location / { proxy_pass http://127.0.0.1:9191; }
}
Then set api.bind: 127.0.0.1 and point clients at the proxy.
Note on login throttling behind a proxy. The daemon's built-in login throttle (10 failed logins per minute → HTTP 429) keys on the immediate peer IP. Behind a reverse proxy every request appears to come from the proxy (loopback), so the throttle becomes global — a burst of bad logins can return 429 to all users at once.
X-Forwarded-Foris deliberately not trusted (it's spoofable). When you front Eneru with a proxy, rely on the proxy's own per-client rate limiting for login endpoints and treat the daemon throttle as a coarse backstop.
There is also a separate process-wide ceiling of 100 failed logins in 300 seconds across all source addresses. It is a distributed-attack backstop: once tripped, every operator receives 429 until the sliding window drains.
Health and readiness
/health returns 200 when the API server can answer.
/ready returns 200 only when monitoring has usable UPS data and every configured shutdown capability is achievable. It returns 503 if UPS visibility is failed, a required local binary is missing on native installs, or a containerized local-host config lacks a healthy loopback delegate.
Prometheus
Prometheus metrics are served from the same API port:
Prometheus scrape example:
scrape_configs:
  - job_name: eneru
    scrape_interval: 15s
    static_configs:
      - targets: ["127.0.0.1:9191"]
Useful metric names include:
| Metric | Meaning |
|---|---|
eneru_up |
API serving metrics |
eneru_ups_battery_charge |
Battery percentage |
eneru_ups_runtime_seconds |
UPS runtime estimate |
eneru_ups_load_percent |
UPS load |
eneru_ups_input_voltage |
Input voltage |
eneru_ups_output_voltage |
Output voltage |
eneru_ups_battery_voltage |
Battery voltage |
eneru_ups_input_frequency_hz |
Input frequency |
eneru_ups_output_frequency_hz |
Output frequency |
eneru_ups_temperature_celsius |
UPS temperature |
eneru_ups_nominal_voltage |
Snapped nominal grid voltage |
eneru_ups_voltage_warning_low |
Derived low-voltage warning threshold |
eneru_ups_voltage_warning_high |
Derived high-voltage warning threshold |
eneru_ups_voltage_state |
Current grid-quality state label |
eneru_ups_avr_state |
Current AVR state label |
eneru_ups_bypass_state |
Current bypass state label |
eneru_ups_overload_state |
Current overload state label |
eneru_ups_depletion_rate_percent_per_minute |
Eneru depletion-rate calculation |
eneru_ups_connection_failed |
UPS visibility failed |
eneru_ups_trigger_active |
Shutdown trigger active/advisory |
eneru_remote_health_status |
Last remote health state |
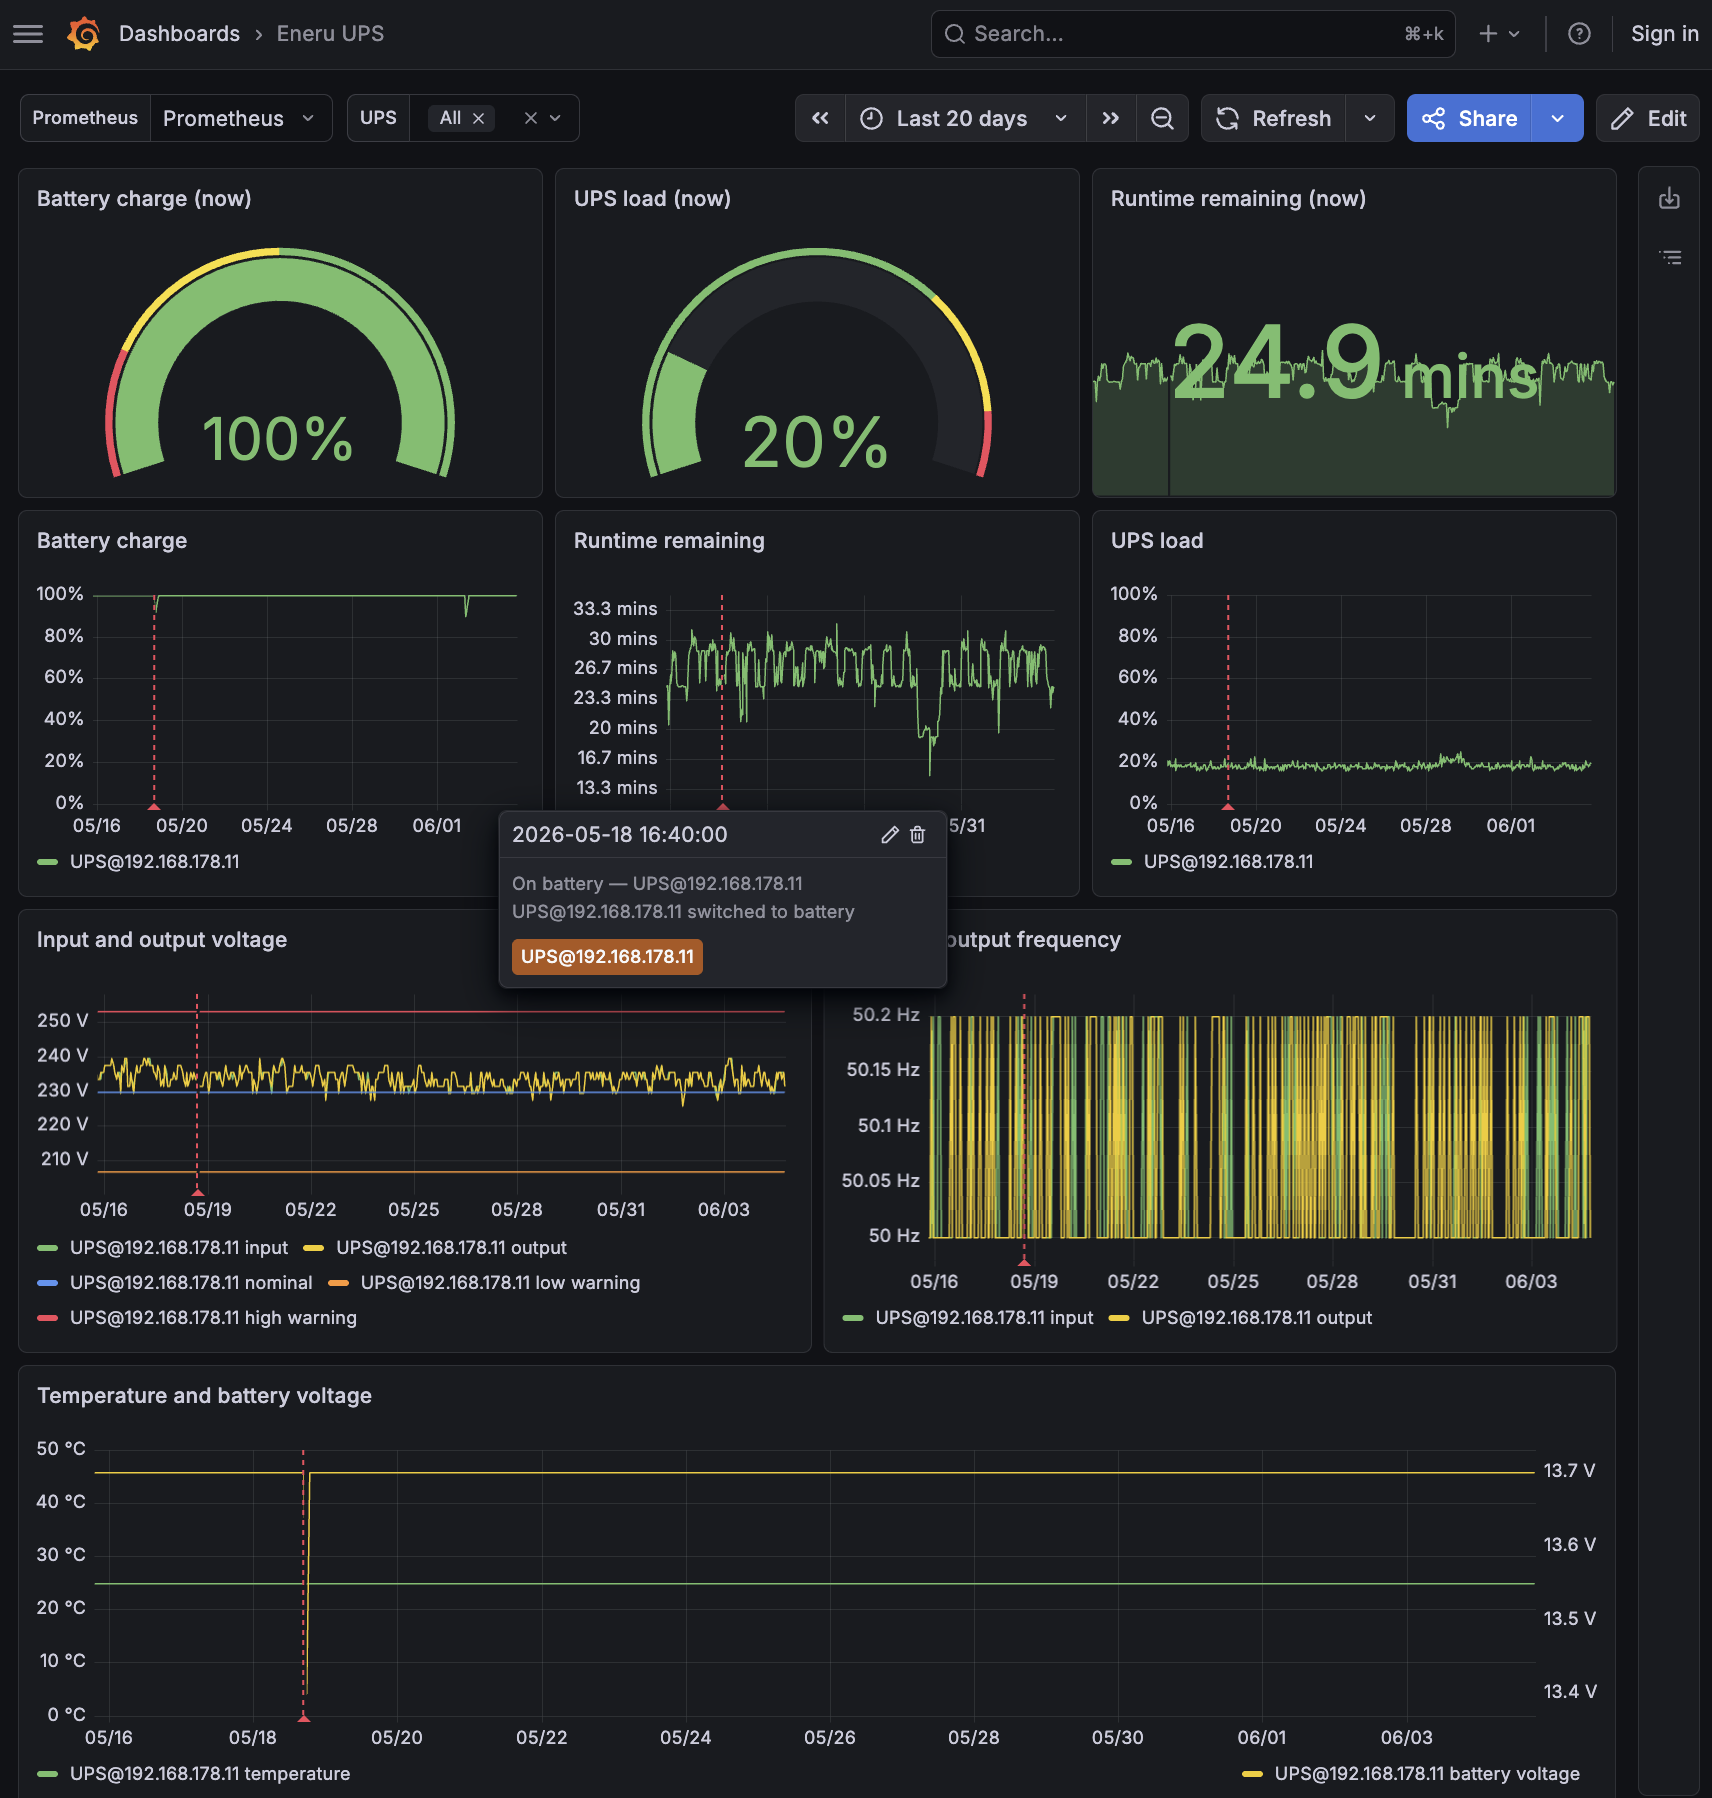
examples/grafana-dashboard.json is a starting dashboard for these metrics.
It is Prometheus-only and ships with a $ups template variable plus
dashboard-wide annotations sourced from existing Prometheus signals
(eneru_ups_time_on_battery_seconds > 0 for power cuts, the voltage /
AVR / bypass / overload state metrics for power-quality events, plus
eneru_ups_trigger_active, eneru_ups_connection_failed, and
eneru_remote_health_status{status="FAILED"} == 1). Annotations render as
coloured regions across every time-series panel, so a power cut is
visible directly on the Battery-charge and Runtime-remaining curves and a
brownout is visible directly on the Input/output voltage panel — no extra
Grafana plugin required. Exact SQLite event rows with their full detail
text remain available from /api/v1/events if you want a tabular feed.
Remote SSH health
Remote healthchecks are enabled by default for configured remote servers. They run a separate harmless probe command, default "true".
remote_health:
  enabled: true
  startup_check: true
  interval: 3600
  probe_command: "true"
  failure_threshold: 2
Healthchecks never execute pre_shutdown_commands, VM/container shutdown commands, custom commands, or shutdown_command. Remote health is advisory: during a real shutdown sequence Eneru still attempts the configured remote command chain with bounded timeouts. Failed or unreachable remote targets are reported in the remote shutdown summary and do not block later shutdown phases indefinitely.
The daemon marks a failed probe as DEGRADED until failure_threshold is reached, then marks it FAILED. It sends at most one failure notification for that failed period and one recovery notification when the target returns. State transitions are also recorded in the SQLite events table.
MQTT
MQTT publishing is outbound only and disabled by default:
Topic, QoS, retention. All snapshots publish to <topic_prefix>/status (default eneru/status) with QoS 0 and retain=False. The payload is the same JSON object served by /api/v1/ups, sorted by key for stable diffing on the consumer side. The publisher emits a new message every time the status fingerprint (everything except generatedAt) changes, and republishes at publish_interval seconds while unchanged so consumers always have a recent sample.
Home Assistant example using the MQTT integration. The numeric power-quality fields can be empty strings when the UPS does not report a value, so the templates default to none (sets the sensor to unavailable) instead of raising a conversion error:
mqtt:
  sensor:
    - name: "Eneru UPS battery"
      state_topic: "eneru/status"
      value_template: "{{ value_json.ups[0].batteryCharge | float(default=none) }}"
      unit_of_measurement: "%"
    - name: "Eneru input voltage"
      state_topic: "eneru/status"
      value_template: "{{ value_json.ups[0].powerQuality.inputVoltage | float(default=none) }}"
      unit_of_measurement: "V"
    - name: "Eneru grid quality"
      state_topic: "eneru/status"
      value_template: "{{ value_json.ups[0].powerQuality.voltageState }}"
Reconnect. On a failed connect or unexpected disconnect, the publisher retries with bounded exponential backoff (1 s → 2 s → 4 s → … capped at 60 s) and resumes publishing automatically once the broker is reachable again. The reconnect loop is interrupted by daemon shutdown, so a hung broker can't delay eneru exiting.
TLS. Set the broker URL to mqtts://... to enable TLS using the system trust store. Default port is 8883 unless explicitly given. mTLS / client certificates are not supported in v5.3.
Packaging. Debian/Ubuntu .deb packages install python3-paho-mqtt as a hard dependency. RPM packages list it under Recommends: only because EPEL coverage is uneven: RHEL 9 + EPEL ships it for the system Python; RHEL 8's EPEL build is for system python3 (3.6) and won't satisfy a python3.9-based install; RHEL 10 doesn't ship it at all. On RHEL 8 and 10, install paho via pip after installing eneru:
# RHEL 8 (python3.9 alternative active):
python3 -m pip install paho-mqtt

# RHEL 10 (PEP 668 — system site-packages externally managed):
python3 -m pip install --break-system-packages paho-mqtt
For PyPI installs use the optional extra:
If MQTT is enabled but paho-mqtt isn't importable, the publisher logs a warning at startup and disables itself; the daemon keeps running normally. No inbound MQTT commands are supported in v5.3.
JSON logs and syslog
Use JSON logs for SIEM pipelines:
Each line is a JSON object with timestamp, level, logger, message, and, when the call site supplies them, category, event_type, group, ups, and server. Power events, shutdown sequences, and remote-health transitions all set the structured fields explicitly; older call sites fall back to a heuristic that parses the message text, so existing log pipelines keep working unchanged.
Forward logs to syslog:
Eneru uses Python's standard logging.handlers.SysLogHandler, which emits RFC 3164 (BSD syslog) format. RFC 5424 structured-data support is not available in v5.3. The existing local power-event logger -t eneru compatibility path remains.